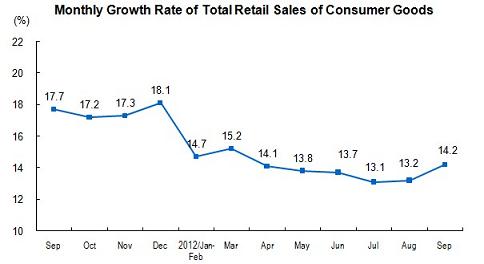
In September, the total retail sales of consumer goods reached 1,822.7 billion yuan, up by 14.2 percent year-on-year (Nominal growth rate. The real growth rate was 13.2 percent. The follows are nominal growth rates if there’s no additional explanation). Of the total, the retail sales of consumer goods of industrial enterprises (units) above designated size was 893.1 billion yuan, increased 14.7 percent. From January to September, the total retail sales of consumer goods reached 14,942.2 billion yuan, up by 14.1 percent year-on-year (actual increase was 11.6 percent after deducting price factors). The total retail sales of consumer goods increased 1.46 percent in September, month-on-month.
 In terms of different areas, the retail sales of consumer goods in urban areas was 1,557.2 billion yuan in September, up by 14.2 percent, year-on-year; while that in rural areas was 265.4 billion yuan, up by 14.7 percent, year-on-year. In terms of different consumption patterns, the catering services in September gained 207.2 billion yuan, up by 13.9 percent, year-on-year; the retail sales of goods gained 1,615.5 billion yuan, up by 14.3 percent, year-on-year, of which, the amount of enterprises (units) above designated size was 823.7 billion yuan, up by 14.8 percent, year-on-year. | Total Retail Sales of Consumer Goods in September | | | Item | September | Jan-Sep | | | Absolute Value(100 million yuan) | Y/Y(%) | Absolute Value(100 million yuan) | Y/Y(%) | | | | | | | | | | Total Retail Sales of Consumer Goods | 18227 | 14.2 | 149422 | 14.1 | | | Of Which: Retail Sales of the Enterprises (units) above Designated Size | 8931 | 14.7 | 71580 | 14.4 | | | Grouped by Different Areas | | | | | | | City | 15572 | 14.2 | 129332 | 14.0 | | | At and Below County Level | 2654 | 14.7 | 20090 | 14.4 | | | Grouped by Consumption Patterns | | | | | | | Catering Services | 2072 | 13.9 | 16673 | 13.2 | | | Of which: Income of Catering Services of the Enterprises (units) above Designated Size | 694 | 13.1 | 5514 | 12.9 | | | Retail Sales of Goods | 16155 | 14.3 | 132749 | 14.2 | | | Of which: Income of Retail Sales of Goods of the Enterprises (units) above Designated Size | 8237 | 14.8 | 66066 | 14.6 | | | Of which: Grain, Oil, Foodstuff, Beverages, Tobacco and Liquor | 1142 | 18.5 | 8826 | 17.2 | | | Garments, Footwear, Hats, Knitwear | 801 | 20.4 | 6665 | 17.8 | | | Cosmetics | 115 | 15.7 | 948 | 16.3 | | | Gold, Silver and Jewelry | 177 | 12.5 | 1611 | 15.7 | | | Commodities | 294 | 15.8 | 2411 | 16.7 | | | Sports and Recreation Articles | 37 | 19.3 | 292 | 8.8 | | | Household Appliances and AV Equipment | 518 | 13.7 | 4202 | 6.1 | | | Traditional Chinese and Western Medicines | 450 | 26.6 | 3491 | 24.2 | | | Cultural and Office Appliances | 199 | 14.7 | 1507 | 19.2 | | | Furniture | 142 | 31.4 | 1051 | 26.2 | | | Communication Appliances | 139 | 24.7 | 1100 | 33.3 | | | Petroleum and Related Products | 1488 | 20.2 | 12214 | 16.7 | | | Automobile | 2058 | 1.7 | 16842 | 6.9 | | | Building and Decoration Materials | 181 | 26.9 | 1320 | 25.7 | | | | | | | | | Notes:
1.The growth rate in this table are all nominal growth rate.2.For parts of data, the total is not equal to the total of sub-items due to round-off. |
Annotations: 1. Explanatory Notes
Total Retail Sales of Consumer Goods: refers to the sales of physical commodity or the income of catering services sold or provided by enterprises (units) to individuals, social organizations for non-production and non-operation purposes. 2.Statistical Coverage The corporate enterprises, industrial activity units or self-employed individuals which retail goods or provide catering services. Enterprises (units) above designated size refer to those wholesale enterprises (units) with an annual revenue from primary business of 20 million yuan and above, those retail enterprises (units) with an annual revenue from primary business of 5 million yuan and above, and those hotel and catering enterprises (units) with an annual revenue from primary business of 2 million yuan and above. 3. Survey Methods All enterprises (units) above designated size are surveyed, while the data of enterprises (units) below designated size are collected by sampling survey. 4. Month-on-Month Figure Revision According to the auto-revision function of the seasonal adjustment model, the growth rate of the total retail sales of consumer goods from September 2011 was revised. The revised figures and figures for September 2012 are as follows:
The Month-on-Month Growth Rate
of Total Retail Sales of Consumer Goods | | | Growth Rate (%) | | | | | 2011- September | 1.33 | | October | 1.47 | | November | 1.40 | | December | 1.52 | | 2012-January | 0.65 | | February | 1.34 | | March | 1.33 | | April | 1.36 | | May | 1.32 | | June | 1.36 | | July | 1.33 | | August | 1.36 | | September | 1.46 |
|
 搜索:通过此功能可以快速搜索本站内容.
 电话:010-84675230 传真:010-84673367
  邮箱:service@zkreport.org